


When OpenTelemetry first came into the picture with the...
Read More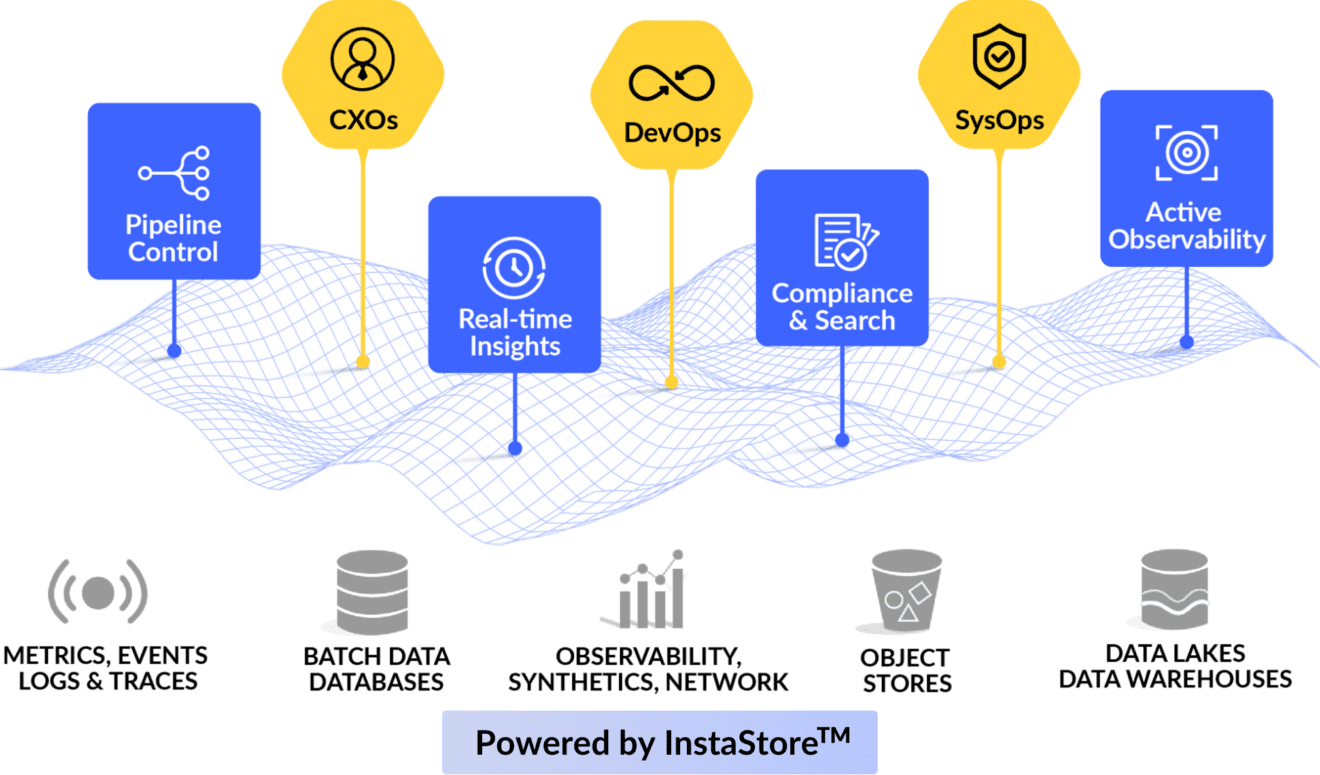


Fast insights.
Infinite-scale.
Ingest and analyze any volume and velocity of data. Search any dataset across any timerange in near real-time. Experience scale with zero need to archive.
Always Own Your Data.
Zero Lock-in.
No lock-ins with data formats, data residency or pricing contracts. Experience observability without constraints and compromises.


High ROI.
Delightful Economics.
With full-access to all features, noise-reduction capabilities, a usage-based pricing model, and highly economical pricing, you realize the highest returns for your investment.
Feature-loaded.
Any type of data.
Customer data, Logs, Sensor data, Metrics, Tracing, Security, AI/ML, Alerts, Visualizations, Pipeline control, and many more. Support for legacy and cloud-native data sources.


SaaS. On-premise.
Or Hybrid.
Launch within your own environment. Or choose to use SaaS. You could also choose a hybrid model where data rests in your cloud while compute is in our SaaS.
Data Compliance with
Zero Gaps.
You can now realize compliance that is both fast and low-cost. With always-indexed data stored on any object storage, compliance is a breeze!


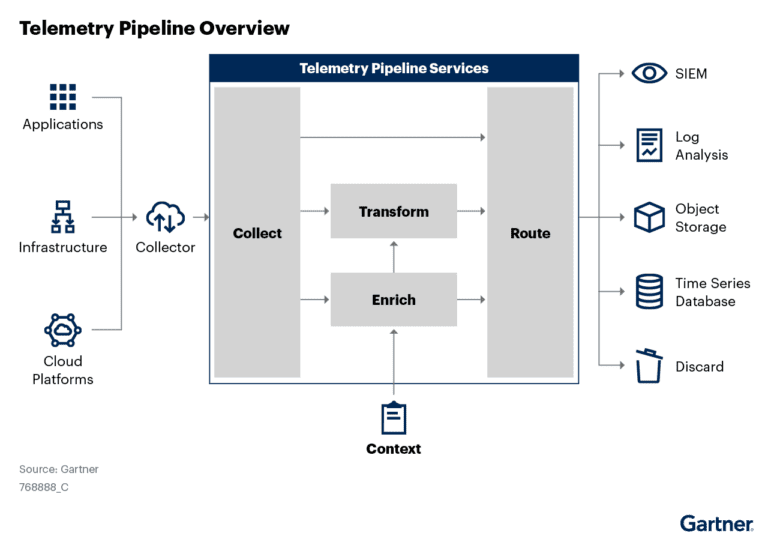
Log Management
Build your observability data lake with a single log aggregation tool that enables you to collect, optimize, analyze, route, and manage log data across your entire stack at any scale.
Pipeline Control
Collect, optimize, store, transform, route, and replay your observability data – whenever, wherever you need it.
APM
Gain from exhaustive and all-inclusive real-time monitoring for all your applications powered by Prometheus. More insights. More affordable. Less hassle.
Infrastructure Monitoring
Gain from exhaustive and all-inclusive real-time monitoring for all your infrastructure components powered by Prometheus. More insights. More affordable. Less hassle.
Distributed Tracing
Troubleshoot and analyze performance issues with Apica’s OpenTelemetry and Jaeger-compatible Distributed Tracing implementation.
Data Convergence
Converge all of your data in one place and get real-time access to the data for operational and analytical needs. Simpler data governance with zero setup and maintenance cost. No unnecessary movement or migration of data.
SIEM/SOAR
Real-time detection of security events, automation to trigger remediation workflows with. Built-in Security, ready to protect your enterprise from threats, malware, and ransomware.
Kubernetes Observability
Complete Kubernetes observability with the ability to ingest logs and metrics from Kubernetes components, pods, nodes, and user applications and observe your entire Kubernetes ecosystem through a single interface.
Error Tracking
Proactively monitor applications and/or microservices to identify problems and fix them before they become serious issues.
Network Monitoring
Constantly monitor your network to proactively identify problems such as slow traffic or component failure. Leverage Prometheus-based agents to stay on top of your network performance.
AIOps
Seamlessly apply machine learning and natural language processing to your observability data and automatically identify anomalies, detect patterns and determine causalities.
API Observability
Analyze your API flows, troubleshoot issues, and understand API usage. Enable development, operations, and security teams to work together to deliver world-class applications.
Open Telemetry
Use Apica.io to instrument, generate, collect, and export telemetry data (metrics, logs, and traces) to help analyze software performance and behavior.
Compliance
1-Click compliance and governance. Leverage any object store to retain and index observability data for months or years with linear performance.
Root Cause Analysis
Leverage Apica’s wide range of tools, techniques and automation to quickly identify root cause of issues and anomalies.
Alert Management
Apica Ships With A Built-In, Powerful, And Flexible Events And Alert Management Engine That Helps Reduce The Noise In Your Alerts. Use Our Simple UI To Create Programmatic Rules That Can Detect Critical Issues In Your Infrastructure In Real-Time.
Build your observability data lake with a single log aggregation tool that enables you to collect, optimize, analyze, route, and manage log data across your entire stack at any scale.
Collect, optimize, store, transform, route, and replay your observability data – whenever, wherever you need it.
Gain from exhaustive and all-inclusive real-time monitoring for all your applications powered by Prometheus. More insights. More affordable. Less hassle.
Gain from exhaustive and all-inclusive real-time monitoring for all your infrastructure components powered by Prometheus. More insights. More affordable. Less hassle.
Troubleshoot and analyze performance issues with Apica.AI’s OpenTelemetry and Jaeger-compatible Distributed Tracing implementation.
Converge all of your data in one place and get real-time access to the data for operational and analytical needs. Simpler data governance with zero setup and maintenance cost. No unnecessary movement or migration of data.
Real-time detection of security events, automation to trigger remediation workflows with. Built-in Security, ready to protect your enterprise from threats, malware, and ransomware.
Complete Kubernetes observability with the ability to ingest logs and metrics from Kubernetes components, pods, nodes, and user applications and observe your entire Kubernetes ecosystem through a single interface.
Proactively monitor applications and/or microservices to identify problems and fix them before they become serious issues.
Constantly monitor your network to proactively identify problems such as slow traffic or component failure. Leverage Prometheus-based agents to stay on top of your network performance.
Seamlessly apply machine learning and natural language processing to your observability data and automatically identify anomalies, detect patterns and determine causalities.
Analyze your API flows, troubleshoot issues, and understand API usage. Enable development, operations, and security teams to work together to deliver world-class applications.
Use Apica.AI to instrument, generate, collect, and export telemetry data (metrics, logs, and traces) to help analyze software performance and behavior.
1-Click compliance and governance. Leverage any object store to retain and index observability data for months or years with linear performance.
Leverage Apica.AI’s wide range of tools, techniques and automation to quickly identify root cause of issues and anomalies.
Apica Ships With A Built-In, Powerful, And Flexible Events And Alert Management Engine That Helps Reduce The Noise In Your Alerts. Use Our Simple UI To Create Programmatic Rules That Can Detect Critical Issues In Your Infrastructure In Real-Time.